SHINDE Stock Brokers provide the complete platform easy to trade Commodity Derivatives on MCX Commodity Exchange online during trading hours using Trading Account. SHINDE Stock Brokers has a wide range of API network & web based process system.
Commodity Exchange Derivatives
☰ DerivativesContract Obligation
✭ Futures
Buy or Sell
Underlier
✺ Commodity
✭ Option
Call or Put
Underlier
✺ Commodity Futures
Account
☰ Derivatives Trading Account✭ HNI Regular Derivatives Trading Account
✺ Linked- Saving Account
✺ Linked- HUF Saving Account
✭ S-HNI Regular Derivatives Trading Account
✺ Linked- Saving Account
✺ Linked- HUF Saving Account
✭ Retail Regular Derivatives Trading Account
✭ Linked- Saving Account
Open Trading Account
Open Trading Account:
✓ Free Trading Account Opening
✓ Free Commodity Derivatives Research Call
✓ Free Bullion Derivatives Research Call
✓ Free Base Metal Derivatives Research Call
✓ Free Energy Derivatives Research Call
✓ Free Electicity Derivatives Research Call
✓ No Profit No Brokarage
✓ A Easy Derivatives Trading Platform
Benefit of our comprehensive training webinars and support as a TRADING ACCOUNT SERVICE
Trader Facility
✭ Initial Margin✭ Span Margin
✭ Minimum Initial Margin
✭ Calendar Spread Margin
✭ Extreme Loss Margin
Trader
✭ Hedger✭ Speculator
✭ Arbitrageur
Trading
✭ Derivatives Trading✺ Commodity Derivatives Trading
✻ Bullion Derivatives Trading
✼ Gold Derivatives Trading
✼ Silver Derivatives Derivatives Trading
✻ Base Metal Derivatives Trading
✼ Aluminium Derivatives Trading
✼ Copper Derivatives Trading
✼ Lead Derivatives Trading
✼ Nickel Derivatives Trading
✼ Zinc Derivatives Trading
✻ Energy Derivatives Trading
✼ Crude Oil Derivatives Trading
✼ Natual Gas Derivatives Trading
✼ Electricity Derivatives Trading
Trading Platform
Trading Tool
Buy Trading ToolAlgo Trading
✭ Easy & Fast API✭ Free of Cost API
✭ Easy Programming
✭ Live Market Feed
✭ Live Market Feed
✭ Real Time Assistance
✭ Work on own algo strategies
✭ Create Algo Trading Platform
✭ Backtest & Optimization
✭ Paper Testing
Activate API TOTP
Algo Trading Platform
Call Option
✭ Call Option Strick Price✺ ITM Call Option Low Risk Immediate Profit
✻ In-The-Money (ITM) Call Option
☘ Intrinsic Value
☘ Time Value (Extrinsic Value)
☘ (Spot Price)>(Call Option Strick Price)
✺ ATM Call Option Moderate Risk Balance Immediate Profit
✻ At-The-Money (ATM) Call Option
☘ Time Value (Extrinsic Value)
☘ Spot Price≅Call Option Strick Price
✺ OTM Call Option High Risk Profit on Volatility & Strategy
✻ Out-of-The-Money (OTM) Call Option
☘ Time Value (Extrinsic Value)
☘ (Spot Price)<(Call Option Strick Price)
Put Option
✭ Put Option Strick Price✺ ITM Put Option Low Risk Immediate Profit
✻ In-The-Money (ITM) Put Option
☘ Intrinsic Value
☘ Time Value (Extrinsic Value)
☘ (Spot Price)<(Put Option Strick Price)
✺ ATM Put Option Moderate Risk Balance Immediate Profit
✻ At-The-Money (ATM) Put Option
☘ Time Value (Extrinsic Value)
☘ Spot Price≅Put Option Strick Price
✺ OTM Put Option High Risk Profit on Volatility & Strategy
✻ Out-of-The-Money (OTM) Put Option
☘ Time Value (Extrinsic Value)
☘ (Spot Price)>(Put Option Strick Price)
Technical Strategy
✭ Bullish✺ Buy Call
✺ Sell Put
✺ Bull Call Spread
✺ Bull Put Spread
✭ Bearish
✺ Buy Put
✺ Sell Call
✺ Buy Put
✺ Bear Put Spread
✺ Bear Call Spread
✭ Neutral
✺ Short Strangle
✺ Short Straddle
✺ Iron Butterfly
✺ Iron Condor
Greeks
✭ Delta✭ Gamma
✭ Theta
✭ Vega
✭ Rho
Simulation
✭ Least Squares Monte Carlo✭ Conditional Monte Carlo
Option Trading Strategy
✭ Income Strategy✺
| Strategies | |
|---|---|
| Component | |
| Potential Profit | |
| Potential Profit | |
| Maximum Loss | |
| Time Value Impact | |
| Break-even |
| Strategies | |
|---|---|
| Component | |
| Potential Profit | |
| Potential Profit | |
| Maximum Loss | |
| Time Value Impact | |
| Break-even |
✺
| Strategies | |
|---|---|
| Component | |
| Potential Profit | |
| Potential Profit | |
| Maximum Loss | |
| Time Value Impact | |
| Break-even |
| Strategies | |
|---|---|
| Component | |
| Potential Profit | |
| Potential Profit | |
| Maximum Loss | |
| Time Value Impact | |
| Break-even |
| Strategies | |
|---|---|
| Component | |
| Potential Profit | |
| Potential Profit | |
| Maximum Loss | |
| Time Value Impact | |
| Break-even |
✺
| Strategies | Long Call |
|---|---|
| Component | Buy call |
| Potential Profit | When the stock price/index level is above the break-even point |
| Potential Profit | Unlimited, equals to the prevailing stock price/index level minus break-even point |
| Maximum Loss | Total premium paid |
| Time Value Impact | Negative |
| Break-even | Strike price/level plus premium paid |
| Strategies | |
|---|---|
| Component | |
| Potential Profit | |
| Potential Profit | |
| Maximum Loss | |
| Time Value Impact | |
| Break-even |
| Strategies | |
|---|---|
| Component | |
| Potential Profit | |
| Potential Profit | |
| Maximum Loss | |
| Time Value Impact | |
| Break-even |
| Strategies | Short Put |
|---|---|
| Component | Sell Put |
| Potential Profit | When the stock price/index level is above the break-even point |
| Potential Profit | Limited to the premium received |
| Maximum Loss | Substantial, equals to break-even point minus stock price/index level |
| Time Value Impact | Positive |
| Break-even | Strike price/level minus premium received |
✺
| Strategies | |
|---|---|
| Component | |
| Potential Profit | |
| Potential Profit | |
| Maximum Loss | |
| Time Value Impact | |
| Break-even |
| Strategies | |
|---|---|
| Component | |
| Potential Profit | |
| Potential Profit | |
| Maximum Loss | |
| Time Value Impact | |
| Break-even |
| Strategies | |
|---|---|
| Component | |
| Potential Profit | |
| Potential Profit | |
| Maximum Loss | |
| Time Value Impact | |
| Break-even |
| Strategies | |
|---|---|
| Component | |
| Potential Profit | |
| Potential Profit | |
| Maximum Loss | |
| Time Value Impact | |
| Break-even |
✺
| Strategies | |
|---|---|
| Component | |
| Potential Profit | |
| Potential Profit | |
| Maximum Loss | |
| Time Value Impact | |
| Break-even |
| Strategies | |
|---|---|
| Component | |
| Potential Profit | |
| Potential Profit | |
| Maximum Loss | |
| Time Value Impact | |
| Break-even |
✺
| Strategies | |
|---|---|
| Component | |
| Potential Profit | |
| Potential Profit | |
| Maximum Loss | |
| Time Value Impact | |
| Break-even |
| Strategies | |
|---|---|
| Component | |
| Potential Profit | |
| Potential Profit | |
| Maximum Loss | |
| Time Value Impact | |
| Break-even |
✺
| Strategies | |
|---|---|
| Component | |
| Potential Profit | |
| Potential Profit | |
| Maximum Loss | |
| Time Value Impact | |
| Break-even |
| Strategies | |
|---|---|
| Component | |
| Potential Profit | |
| Potential Profit | |
| Maximum Loss | |
| Time Value Impact | |
| Break-even |
| Strategies | |
|---|---|
| Component | |
| Potential Profit | |
| Potential Profit | |
| Maximum Loss | |
| Time Value Impact | |
| Break-even |
| Strategies | |
|---|---|
| Component | |
| Potential Profit | |
| Potential Profit | |
| Maximum Loss | |
| Time Value Impact | |
| Break-even |
| Strategies | |
|---|---|
| Component | |
| Potential Profit | |
| Potential Profit | |
| Maximum Loss | |
| Time Value Impact | |
| Break-even |
| Strategies | |
|---|---|
| Component | |
| Potential Profit | |
| Potential Profit | |
| Maximum Loss | |
| Time Value Impact | |
| Break-even |
✺
| Strategies | |
|---|---|
| Component | |
| Potential Profit | |
| Potential Profit | |
| Maximum Loss | |
| Time Value Impact | |
| Break-even |
| Strategies | |
|---|---|
| Component | |
| Potential Profit | |
| Potential Profit | |
| Maximum Loss | |
| Time Value Impact | |
| Break-even |
| Strategies | |
|---|---|
| Component | |
| Potential Profit | |
| Potential Profit | |
| Maximum Loss | |
| Time Value Impact | |
| Break-even |
| Strategies | |
|---|---|
| Component | |
| Potential Profit | |
| Potential Profit | |
| Maximum Loss | |
| Time Value Impact | |
| Break-even |
✺
| Strategies | |
|---|---|
| Component | |
| Potential Profit | |
| Potential Profit | |
| Maximum Loss | |
| Time Value Impact | |
| Break-even |
| Strategies | |
|---|---|
| Component | |
| Potential Profit | |
| Potential Profit | |
| Maximum Loss | |
| Time Value Impact | |
| Break-even |
✺
| Strategies | |
|---|---|
| Component | |
| Potential Profit | |
| Potential Profit | |
| Maximum Loss | |
| Time Value Impact | |
| Break-even |
| Strategies | |
|---|---|
| Component | |
| Potential Profit | |
| Potential Profit | |
| Maximum Loss | |
| Time Value Impact | |
| Break-even |
Algo Trading Strategy
✭ Bullion Algo Trading Strategy✭ Base Metal Algo Trading Strategy
✭ Energy Algo Trading Strategy
✭ Electricity Futures Algo Trading Strategy
Option Pricing Formula
✭ Black Scholes Option Pricing Formula✺ Call Option Pricing Formula
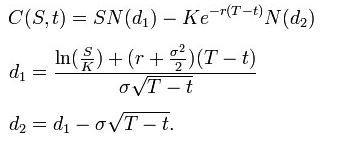 ✺ Put Option Pricing Formula
For both, as above N is the cumulative distribution function of the standard normal distribution T – t is the time to maturity S is the spot price of the underlying asset K is the strike price r is the risk free rate (annual rate, expressed in terms of continuous compounding) σ is the volatility in the log-returns of the underlying
Option Data
✭ Option Chain✺ Call Option Chain
✺ Put Option Chain
✭ Heatmap
✺ Option Heatmap
✭ OI Stastics
✺ Cumulative OI
✺ Cumulative OI Change
✺ Individual OI
✺ Individual OI Change
✭ Trending OI
✺ Trending OI Sentiment
✺ Trending OI
✺ Individual OI
✭ PCR Ratio
✺ PCR Ratio Data
✺ PCR Ratio Chart
✭ Option Analysis Chart
✺ Call OI Analysis Chart
✺ Put OI Analysis Chart
✺ Call Vs Put OI Analysis Chart
✺ Combined Premium Chart
✺ Payoff Chart
✺ Multi Strike OI Chart
Futures Data
✭ Heatmap✺ Future Heatmap
Risk Analysis
✭ Market Volatility✺ India VIX Volatility Index
✺ CBOE VIX Volatility Index
✭ Interest Rate Hike Risk
✺ Repo Rate
✺ Reverse Repo Rate
✺ EBLR
✺ MIBOR
✺ MIBOR
Risk Strategy
✭ Hedging✺ Back-to-Back Hedge
✺ Tracker Hedge
✺ Delta Hedge
✺ Risk Reversal Hedge
✺ Commodity Forwards Sell
✺ Commodity Forwards REPO
✺ Commodity Swaps FRA
Market Data
✭ SMC Data✺ SMC Commodity Daily Analysis Research Reports
Research Analytics
☰ Trading AnalyticsSubscribe Commodity Derivatives Research
✭ Derivatives Trading
✺ Commodity Derivatives Trading
✻ Bullion Derivatives Trading
☘
♣ Gold Futures
♣ Gold Options
♣ Silver Futures
♣ Silver Options
♣ Bullion Index Futures
☘
♣ Aluminium Futures
♣ Copper Futures
♣ Copper Optons
♣ Lead Futures
♣ Nickel Futures
♣ Zinc Futures
♣ Zinc Options
♣ Base Metal Index Futures
☘
♣ Crude Oil Futures
♣ Crude Oil Options
♣ Natual Gas Futures
♣ Natual Gas Options
♣ Energy Index Futures
☘
♣ Electicity Futures
♣ Electricity Options
| Commodity Derivatives | Carry Forward Trading | Regular Market Session | 9:00 a.m. to 11:30 p.m | MCX Commodity Exchange |
|---|---|---|---|---|
| Commodity Derivatives | Intra-day Trading | Regular Market Session | 9:00 a.m. to 11:09 p.m | MCX Commodity Exchange |
| Commodity Derivatives | Auto Square-off Time | Market Closing Session | 11:10 p.m | MCX Commodity Exchange |
| Commodity Derivatives | After Market Order (AMO) | After-Market Session | 11:58 p.m. to 5:30 a.m | NSE, BSE, MCX Commodity Exchange |
☰ Derivatives Features
| Instrument | Exchange | Contract Size | Contract Cycle | Expiry Date | Settelment |
|---|---|---|---|---|---|
| Gold | MCX | 1Kg | 12 Months | 5th day of the contract | Cash Settled/Physically Delivered |
Sign-up Trading Account to trade Derivatives on MCX Commodity Exchange.
Open Trading Account
☰ Funding Method
✭ UPI
✭ Net Banking
☰ Commodity Future Trading Charges
| Brokerage (Standard Plan) | Rs. 20/- FLAT per Executed Order |
|---|---|
| Brokerage (Smart Plan) | Rs. 0/- FLAT per Executed Order |
| Commodity Transaction Tax (CTT) | Not Applicable |
| Transaction Turnover Charges | NSE 0.00090% | BSE 0.00090% |
| SEBI Fee | 0.00010% |
| GST | 18% on [ Brokerage + TC + SEBI Fee] |
| Stamp Duty | 0.00010% [Only on Buy order] |
| Clearing Charges | 0.0004% |
| Brokerage (Standard Plan) | Rs. 20/- FLAT per Executed Order |
|---|---|
| Brokerage (Smart Plan) | Rs. 0/- FLAT per Executed Order |
| Commodity Transaction Tax (CTT) | Not Applicable |
| Transaction Turnover Charges | NSE 0.035% | BSE 0.001% |
| SEBI Fee | 0.00010% |
| GST | 18% on [ Brokerage + TC + SEBI Fee] |
| Stamp Duty | 0.00010% [Only on Buy order] |
| Clearing Charges | 0.001% |
Our Team
A team of Dynamic and Talented Professionals and a diverse team comprising engineers, tech geeks, market experts, finance experts, and a dedicated support team to deliver a better and enhanced trading experience hitherto undreamt of.
Customer
SHINDE Stock Brokers HNI customers are Promotors, Directors, Partners, Proprietors & HUF across India. SHINDE Stock Brokers retail customers are resident individuals across India and non-resident individuals all over world.
Regulator

Depository


Cleaning and Settlement

Commodity Exchange

SHINDE Stock Brokers is a business partner Stock Broker AP for SEBI registered Stock Broker | MONEYWISE FINVEST LIMITED | SEBI REGN No. INZ000196835 | Member: NSE: EQ, FO, CDS, COM, DEBT 90161 | BSE: EQ, FO, CDS, COM, DEBT 6690 | MCX: COM 56325. SHINDE Stock Brokers is a business partner for SEBI registered Research Analyst | SMC GLOBAL SECURITIES LIMITED | SEBI REGN No. INH100001849.
Investments in securities market are subject to market risks. Read all the related documents carefully before investing. Refer the Risk Disclosure Document issued by SEBI. Insurance is a subject matter of solicitation.
KYC: SHINDE Stock Brokers follow Know Your Customer (KYC) Guidelines - Anti-Money Laundering Standards for all financial transactions under the Prevention of Money Laundering Act, 2002 and insist customer to submit officially valid documents as proof of name and address. The officially valid documents means PAN card number and Aadhaar Card number or GST nummber. For more detail send mail at tushar@shinde.org or call us on telephone no. 9320690034.
Tushar Shinde is the founder, promoter and CEO of SHINDE Stock Brokers.
Contact us
✆ 9321690034


✆ 9320690034
✆ 9820690034
✉ tushar@shinde.org
www.shinde.org

Tushar Shinde
CEO
SHINDE Stock Brokers
Marketing Office :
B/402, Lotus Corporate Park
Laxmi Nagar, Goregaon (E)
Mumbai - 400063
Maharashtra
India
Registered Address :
202, Rachana Apartment, Anand Nagar
Kulgaon, Badlapur (E)
Thane - 421503
Maharashtra
India
Join Telegram Channel SHINDE
Follow Instagram Channel TUSHAR SHINDE